
Home › Learn & Trade › Trader Foundations › Technical Analysis for Beginners
Trader Foundations
Technical Analysis for Beginners
Technical analysis can look complicated when a chart is covered with indicators, lines and patterns. It becomes much easier when you learn the foundations in the right order: price, structure, trend, levels, behavior, then indicators.

What You Will Learn:
Table of Contents:
- What Is Technical Analysis?
- What Technical Analysis Can — and Cannot — Do
- Understanding Price Charts
- Candlesticks for Beginners
- Trend and Market Structure
- Support and Resistance
- Trend Lines and Channels
- Volume and Volatility
- Moving Averages
- RSI and MACD: What Beginners Should Know
- Chart Patterns Without the Hype
- Multiple-Timeframe Analysis
- How to Perform Technical Analysis Step by Step
- Common Technical Analysis Mistakes
- Frequently Asked Questions
- Sources and Further Reading
What Is Technical Analysis?
Technical analysis is a way of studying market information — especially price and, where available, volume — to identify patterns, trends, levels and changes in market behavior. Traders use charts and analytical tools to organize this information before making a trading decision.
One well-known technical-analysis learning path starts with reading price charts and then progresses into trends, reversal patterns, support and resistance, and oscillators. That sequence is useful for beginners because it puts the chart before the indicator.
The most important beginner principle: An indicator is not the market. It is a mathematical transformation of market data. Learn to understand the underlying price behavior first.
What Technical Analysis Can — and Cannot — Do
Technical analysis can help you describe what has happened, identify recurring structures, define important areas and create consistent rules. It cannot guarantee what happens next.
It can help you…
It cannot…
Investing involves risk and uncertainty, and its online-investing guidance stresses that fast execution does not eliminate the need to understand the investment and its risks.
Understanding Price Charts
A chart is a visual record of price over time. Common beginner chart types are line, bar and candlestick charts. The first skill is not recognizing dozens of patterns; it is understanding what the chart is actually showing.
Line chart
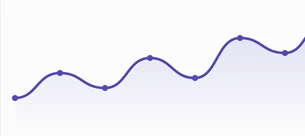
Only the close of each period. Cleanest and easiest for spotting the overall trend, but hides the open, high, and low, so it hides how volatile each period actually was.
Bar chart
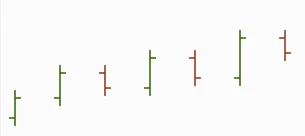
The same four data points (open, high, low, close) as a candlestick, just without the filled body, so direction has to be read from the tick positions rather than a color at first glance.
Candlestick chart
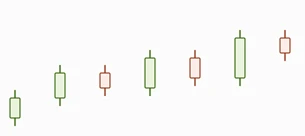
The most information-dense: a colored body for the open-to-close range, plus wicks for the high and low. Easiest to read at a glance because color instantly signals up vs down.
For most trading education, candlesticks are a practical starting point because they combine four pieces of price information into each candle: open, high, low and close.
Candlesticks for Beginners
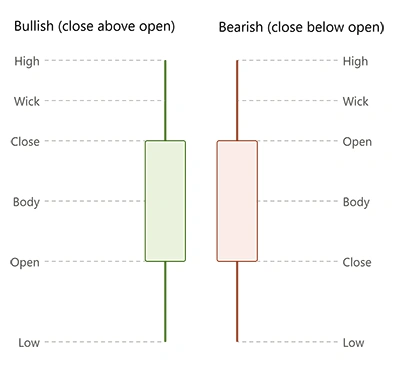
A candlestick represents price behavior during one selected period. The body shows the relationship between the open and close, while the upper and lower wicks show the highest and lowest prices reached during that period.
| Label | What It Tells You | Beginner Question |
|---|---|---|
| Open | Where the period started. | Where did price begin? |
| Close | Where the period ended. | Who controlled the period at the close? |
| High | Highest traded price. | Was the high accepted or rejected? |
| Low | Lowest traded price. | Did price recover from the low? |
| Body | Distance between open and close. | How large was the net movement? |
| Wicks | Movement beyond the body. | Did price travel somewhere and then retreat? |
One candle is rarely enough to understand the market. Context matters. A long lower wick near established support means something different from the same candle in the middle of a strong trend.
Trend and Market Structure
Trend is one of the most useful concepts in technical analysis. A common bullish structure is a sequence of higher highs and higher lows; a common bearish structure is lower highs and lower lows.
| Term | Meaning | Typical Context |
|---|---|---|
| HH | Price previously stalled or reversed. | New swing high exceeds the previous relevant swing high. |
| HL | Higher Low | Pullback low remains above the previous relevant low. |
| LH | Lower High | Rally fails below the previous relevant high. |
| LL | Lower Low | New swing low falls below the previous relevant low. |
Market structure should be read from meaningful swings rather than every tiny fluctuation. Your definition of a meaningful swing should be consistent with your trading timeframe.
Remember: A trend is not a straight line. Trends contain pullbacks, consolidations and temporary counter-moves. The question is whether the larger structure remains intact.
Support and Resistance
Support and resistance describe areas where price may slow, pause or change direction. They can be identified from previous highs and lows, important price levels, trend lines and moving averages.
Support
An area below current price where previous selling pressure was absorbed or where price previously found buying interest.
Ask: What happened the last time price reached this area?
Resistance
An area above current price where previous buying pressure was absorbed or where price previously found selling interest.
Ask: Did price previously stall, reverse or break through?
Do not treat support and resistance as perfect lines. They are better viewed as zones that may stop or slow price. A broken support area can later behave as resistance, and vice versa.
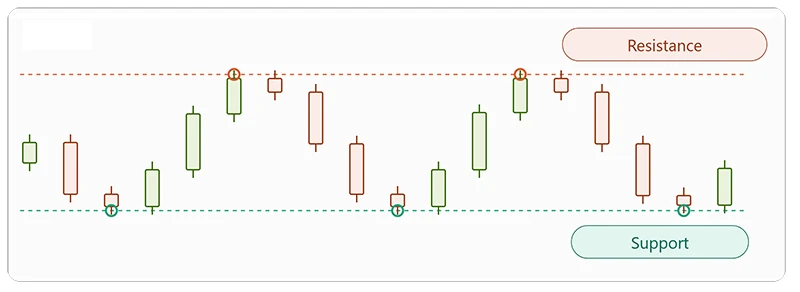
This shows price rejected twice at the same resistance level (marked with coral circles) and bouncing three times off the same support level (teal circles), with fully continuous candles — every open still connects to the prior close.
The more times a level gets tested and holds, the more traders watch it, and the stronger it’s considered — but eventually one of these levels usually breaks, which is often when the next big move starts. It’s also worth mentioning role reversal: once a resistance level finally breaks, it often becomes the new support on the next pullback (and vice versa for a broken support level).
Trend Lines and Channels
A trend line connects meaningful highs or lows to make directional structure easier to visualize. In an uptrend, traders commonly connect successive lows; in a downtrend, successive highs.
Use for Context
Trend lines can make direction and slope easier to see.
Use Meaningful Swings
Do not force a line through every small fluctuation.
Do Not Overtrust It
A broken line is information, not a guaranteed reversal signal.
Channels extend this idea with a parallel boundary. They can help visualize the approximate area in which price has been moving, but they remain contextual tools.
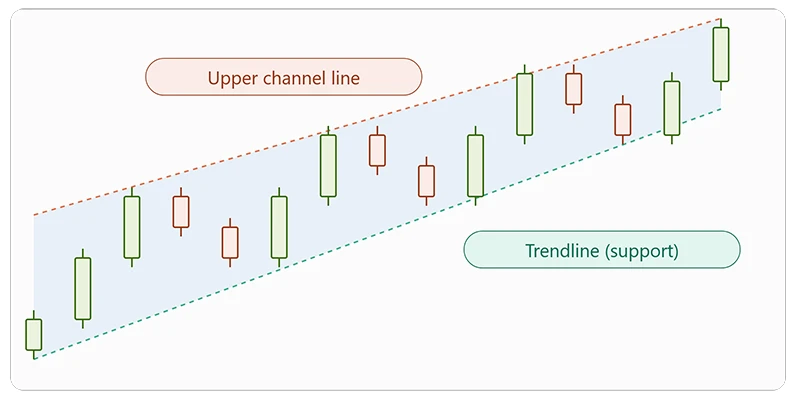
This shows a rising channel: the teal trendline connects a series of higher lows (the up-trend line, which acts as dynamic support), and the parallel coral line connects the higher highs above it, giving price a defined lane to move within. Same continuity as the other charts — every candle’s open matches the prior candle’s close.
A trendline needs at least two touches to draw and a third touch that holds to confirm it’s meaningful, not just a line connecting two random points. And just like support and resistance, a break of the channel line — especially with a strong candle and rising volume — is often treated as an early trend-change signal.
Volume and Volatility
Volume measures trading activity where reliable volume data is available. Volatility describes how much price is moving over time. They answer different questions.
| Concept | Main Question | Example Use |
|---|---|---|
| Volume | How much activity accompanied the move? | Compare activity during a breakout with quiet consolidation. |
| Volatility | How large and variable are price movements? | Adjust expectations for stop distance and position size. |
| ATR | How large have recent ranges been? | Use as a volatility reference rather than a directional signal. |
Forex Note: Spot OTC forex does not have one centralized exchange-wide volume feed. Be careful about treating broker-specific tick volume as complete global forex volume.
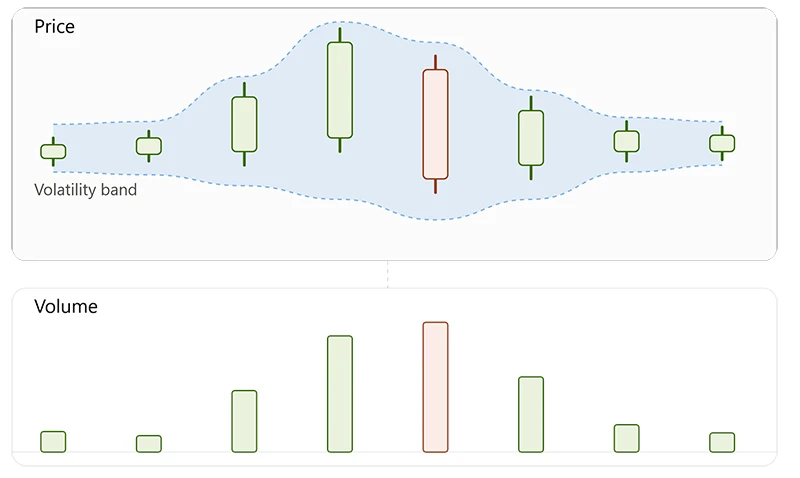
This one ties volume and volatility together directly: the shaded band around price stays narrow while the market is calm, then widens sharply during the breakout candle — and the volume bars below grow tall at exactly the same point, then shrink back down as things settle.
That’s the core lesson for beginners: volatility (how much price swings) and volume (how much is traded) tend to rise and fall together, especially around breakouts and news events.
Moving Averages
A moving average smooths a series of prices over a selected number of periods. Simple moving averages and exponential moving averages are two common forms, and moving averages are widely regarded as a common starting point for price analysis.
SMA
A simple moving average gives equal weight to the observations included in its calculation.
EMA
An exponential moving average gives greater weight to more recent observations, making it respond more quickly to recent price changes.
SMA = Sum of selected prices ÷ Number of selected periods
Moving averages can help visualize trend, compare short- and long-term price behavior, or identify areas where price has reacted. Crossovers are also commonly studied, but a crossover is not a guarantee of future direction.
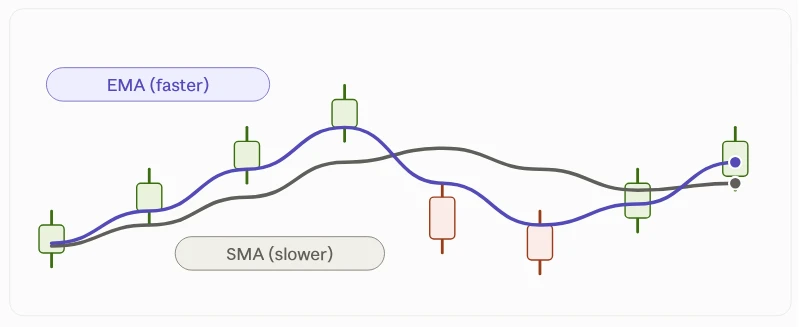
Candles show a rally, a sharp drop, and a recovery, with the gray SMA line lagging noticeably behind the move while the purple EMA line hugs price much more closely — especially visible right at the crash, where SMA is still climbing while price and EMA have already turned down.
SMA smooths out noise but reacts slowly, while EMA weights recent price more heavily so it responds faster, at the cost of being a bit more sensitive to short-term noise.
RSI and MACD: What Beginners Should Know
Oscillators attempt to summarize aspects of momentum or price movement. Beginners should understand what each indicator measures before using it.
RSI
The Relative Strength Index is a momentum oscillator commonly displayed on a 0–100 scale. Traders often study areas such as 70 and 30, but these are conventions—not universal buy and sell rules.
Question: Is momentum strengthening, weakening or diverging from price?
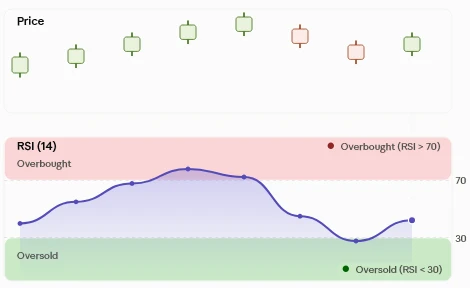
As price pushes up into a strong rally (green candles), the RSI line climbs into the overbought zone above 70. When price pulls back (red candles), RSI drops into the oversold zone below 30.
- Overbought/oversold doesn’t mean “reverse immediately.” In a strong trend, RSI can stay above 70 or below 30 for a while.
- It pairs well with the risk-management point from before: RSI is one signal among several, not a standalone trade trigger.
MACD
MACD is built from moving averages and is commonly used to study momentum and trend changes. Traders may examine its lines and histogram.
Question: Is momentum supporting the trend or changing?
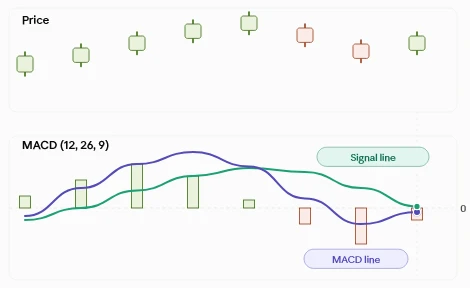
the purple MACD line crosses the teal signal line, and the histogram bars grow and shrink to show the gap between them, flipping from green to red at the crossover.
Price makes its highest candle around the middle of the chart, but the histogram bars are already shrinking at that point. That’s a bearish divergence — momentum fading while price is still rising — a common early warning sign.
Do not turn indicators into traffic lights. “Green means buy, red means sell” is too simplistic. Context, market regime and risk still matter.
Chart Patterns Without the Hype
Technical analysts study recurring shapes such as triangles, rectangles, flags and pennants. These are commonly classified among continuation patterns, which can occur during pauses within established trends.
Triangle
Price contracts into a narrower area as opposing boundaries converge.
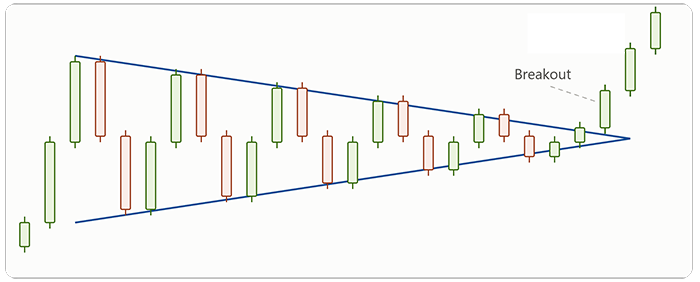
Swing highs getting lower (coral resistance line), swing lows getting higher (teal support line), squeezing into a tight range in the middle, then the price bursts upward through resistance with a strong green candle.
Triangles can break either direction, and it’s the volume/volatility squeeze followed by a decisive breakout candle that confirms the move — not the shape alone.
Rectangle
Price consolidates between approximately horizontal boundaries.
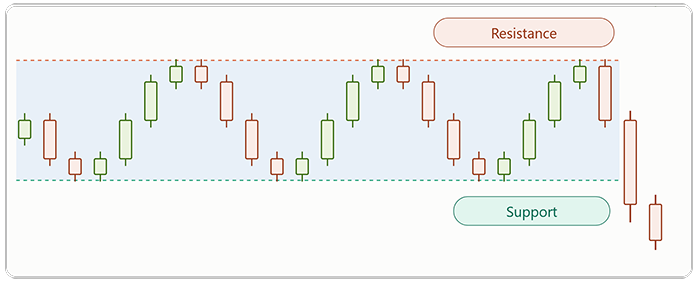
A rectangle pattern forms when price gets stuck moving sideways between a flat resistance level above and a flat support level below, as shown in the chart. Instead of trending, the market bounces back and forth between these two boundaries several times, rejecting each push higher at resistance and each dip lower at support. This kind of pause is common after a strong move, as buyers and sellers temporarily reach a standstill while the market decides its next direction.
Flag / Pennant
A short consolidation can appear after a strong directional move.
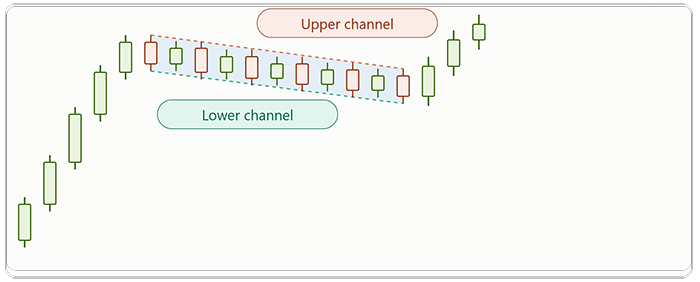
Five strong green candles forming the flagpole (a sharp rally), then a narrow downward-drifting channel where price consolidates against the trend, then a breakout that continues upward in the same direction as the pole. Same continuity rule as before — every open connects to the prior close, no gaps.
A flag has parallel channel lines (like here); a pennant is the same.
The mistake is treating a pattern name as a prediction. Define the pattern, identify what would invalidate it, and then observe what price actually does.
Multiple-Timeframe Analysis
The same instrument can look bullish on a daily chart and bearish on a 15-minute chart. These observations are not necessarily contradictory: the shorter movement may be occurring inside the larger trend.

Higher Timeframe
Determine the broad market environment.

Setup Timeframe
Locate the structure and area where your strategy operates.

Execution Timeframe
Refine the entry only after context is clear.
Choose timeframes based on your trading horizon and define the role of each one. More timeframes do not automatically produce better analysis.
How to Perform Technical Analysis Step by Step
A beginner can spend an hour adding indicators and still have no clear idea what the market is doing. A fixed sequence is more useful.
Start with price.
Look at the chart without indicators. Identify broad direction and major swings.
Classify the market.
Decide whether it is trending, ranging or transitioning.
Mark structure.
Identify meaningful HH, HL, LH and LL sequences.
Mark important zones.
Use previous highs/lows and reaction areas to identify support and resistance.
Study current behavior.
Is price continuing, pulling back, consolidating, rejecting or breaking?
Add only useful indicators.
Use an indicator to answer a specific question rather than to create more signals.
Check another timeframe.
Make sure the setup is understood within larger context.
Define invalidation.
Write down what price would need to do for your analysis to be wrong.
Apply risk rules.
Position size, stop loss and total exposure should come from your risk plan—not from confidence in the chart.
Price → Structure → Levels → Behavior → Confirmation → Invalidation → Risk
If your analysis requires ten indicators to explain why a trade should work, simplify it.
A good beginner process should be explainable in a few clear sentences.
Common Technical Analysis Mistakes
| Mistake | Why It Causes Problems | Better Approach |
|---|---|---|
| Indicator overload | Conflicting signals make decisions harder. | Start with price and use a small number of tools with defined jobs. |
| Changing indicators constantly | It prevents consistent testing and review. | Keep a stable method long enough to evaluate it. |
| Ignoring market regime | A trend strategy may behave differently in a range. | Classify the market before applying a setup. |
| Drawing too many levels | Every price starts to look significant. | Keep only meaningful zones. |
| Trading every pattern | Patterns are probabilistic interpretations, not guarantees. | Combine pattern, context, location and invalidation. |
| Moving the stop because of hope | The original risk calculation becomes meaningless. | Define risk rules before entering. |
| Backtesting only winning examples | Selection bias creates unrealistic confidence. | Test complete samples including losses, costs and different market conditions. |
| Confusing analysis with prediction | A clear chart does not make the future certain. | Think in scenarios and invalidation conditions. |
f.a.q.
You have questions. We have answers.
These answers provide general educational information and should not be treated as personal financial advice.
The terminology can be large, but the foundation is manageable. Start with price charts, trend, market structure, support and resistance, then add indicators gradually.
Learn how to read a candlestick, identify meaningful highs and lows, recognize trend versus range, and mark support and resistance.
There is no universal number, but beginners generally benefit from simplicity. Every indicator should have a defined purpose.
They answer different questions and neither is universally better. RSI is commonly used for momentum conditions, while MACD is built from moving averages and is commonly used to study momentum and trend changes.
No method can guarantee the next movement. Technical analysis organizes evidence and creates rules; risk management remains essential.
Technical analysis is widely used across markets, including currencies. Forex has its own liquidity, cost and leverage characteristics. CFTC warns that OTC forex involves substantial risk and leverage can amplify gains and losses.
External Sources and Further Reading
Turn Technical Analysis Into a Trading Plan
Technical analysis tells you how to study the market. Your trading plan determines when you act, how much you risk and when an idea is no longer valid.
Learn about risk per trade, position sizing, drawdown and losing streaks.
Build a trading plan with clear entry and exit rules, risk limits, trade management and a practical pre-trade checklist.
Understand the behavioral, financial and process-related reasons many traders struggle.
Risk notice:
Forex and CFD trading involves substantial risk. This article is educational and does not provide personalized investment advice or guarantee trading results.
 to be a light for all traders.